
The MuleSoft Telemetry Exporter enables you to export audit logs and trace data from apps to third-party observability and analytics apps, such as Azure Monitor, Splunk HEC, and OpenTelemetry compliant tools. In this codelab, we’ll show you how to configure it for Grafana. Some things to keep in mind. To use the Telemetry Exporter, you must:
- Create a connection with a third-party app to authorize Anypoint Platform to share data.
- Create a configuration to specify the types of data Anypoint Platform exports and which business groups and environments allow content to be exported to connections.
Setup Mule Application
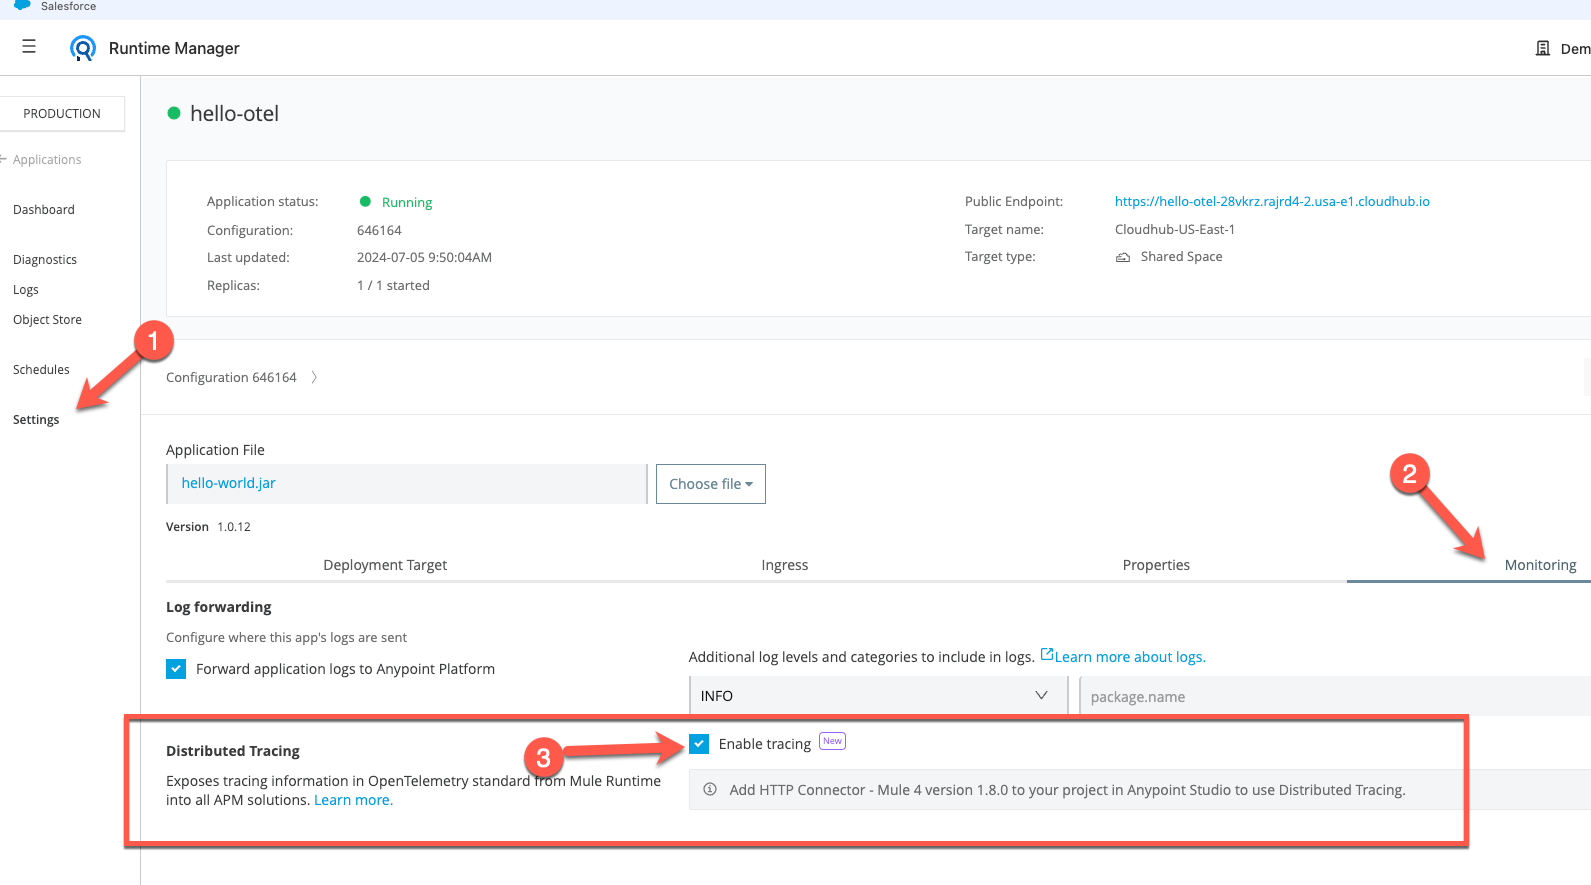
Before we jump into setting up the Telemetry Exporter, check to see if your Mule application is configured for Distributed Tracing.
Navigate to the Runtime Manager and open the application that you’d like to see data for in Grafana. In the Settings page of the application, click on Monitoring and scroll down. Distributed Tracing should have Enable tracing checked.
Grafana – Configure Open Telemetry
Open a new tab in your browser and navigate to the following URL:
| https://grafana.com/ |
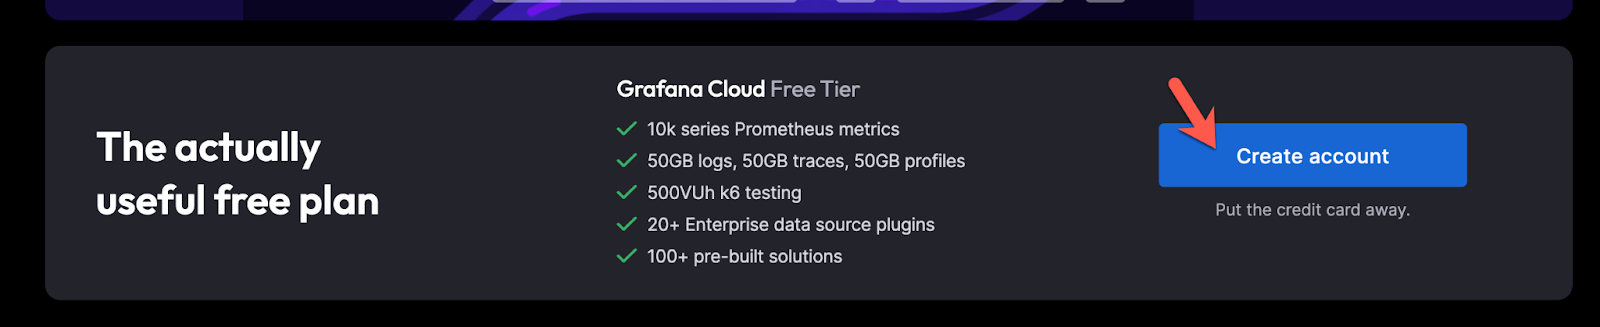
Create a Grafana Cloud Free Tier account
Or click on Sign In
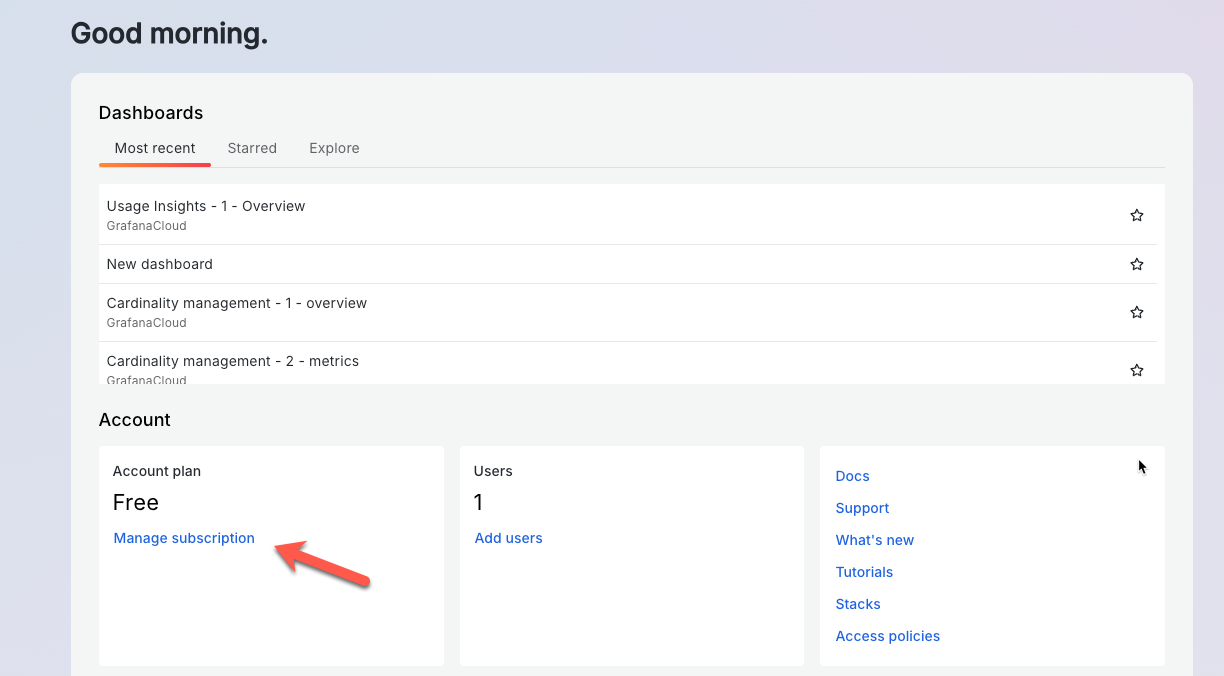
Once you’re logged in, on the Home page, click on Manage subscription.
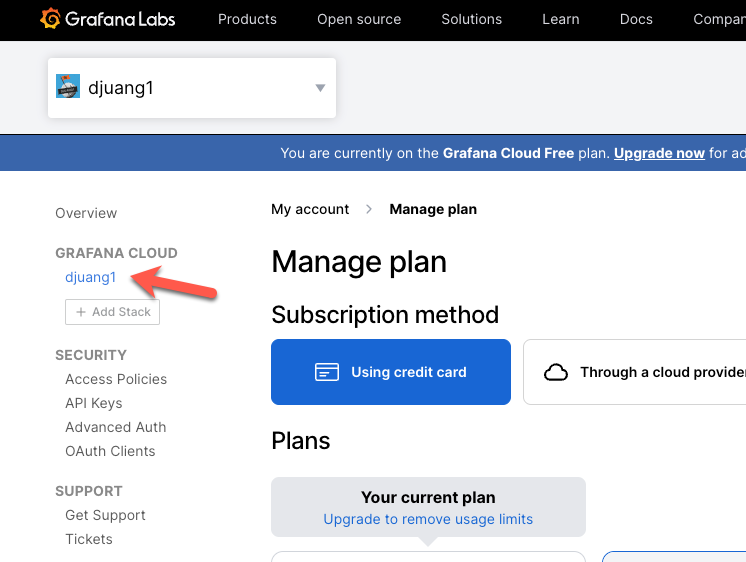
In the Manage plan screen, click on the name of your Grafana Cloud instance name.
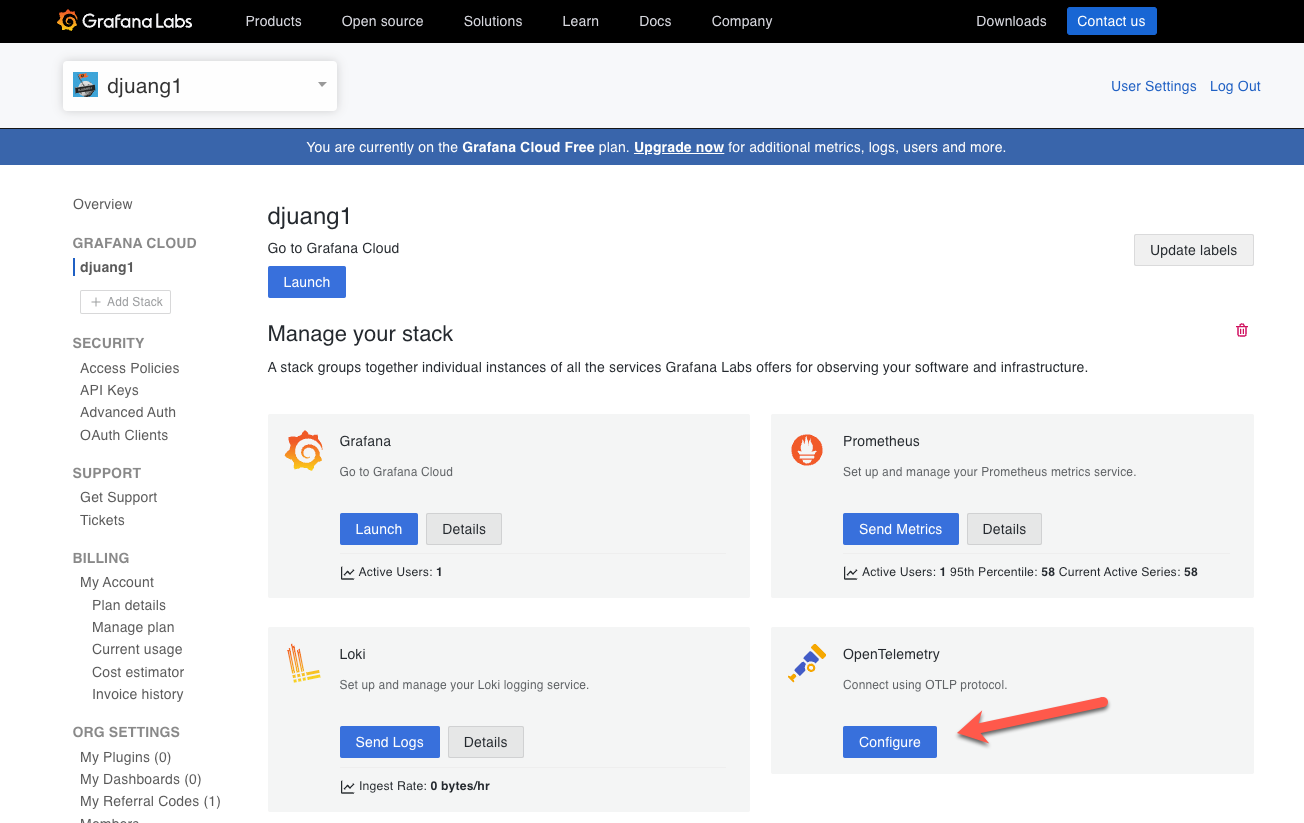
Click on Configure under OpenTelemetry
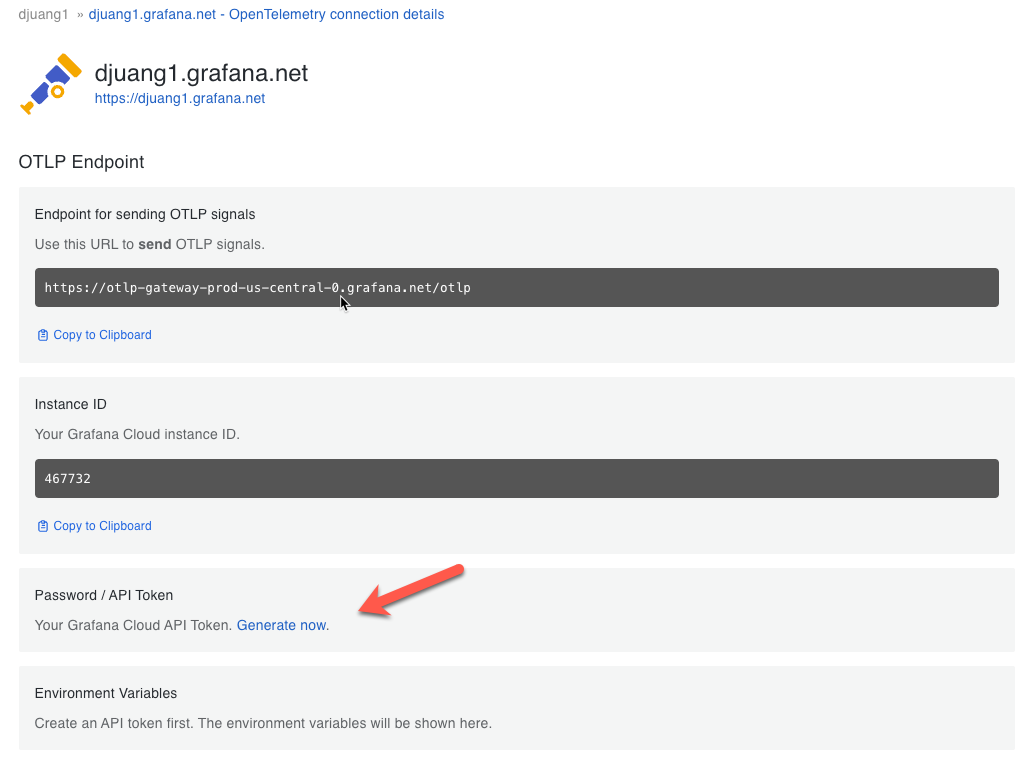
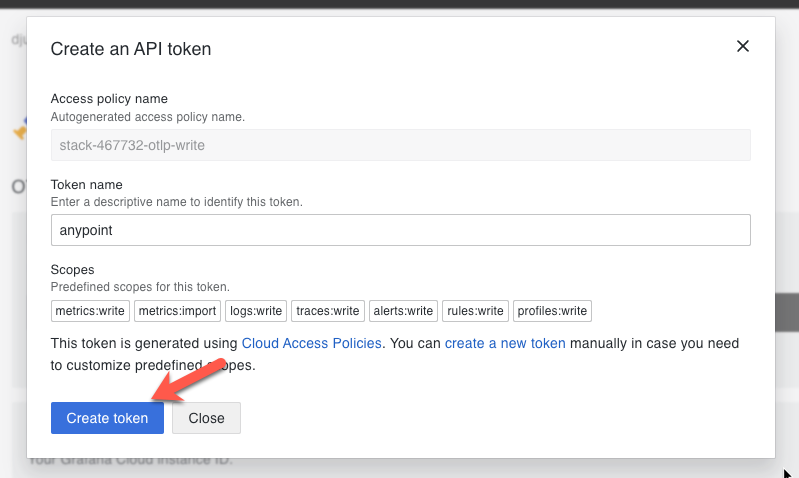
In the Password / API Token section, click on Generate now
Click on Create Token
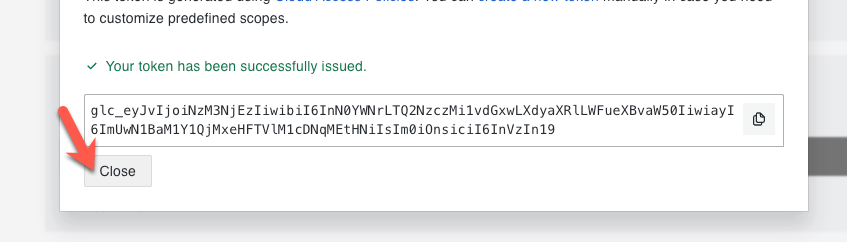
Copy the token and save it somewhere if you’d like. Click on Close
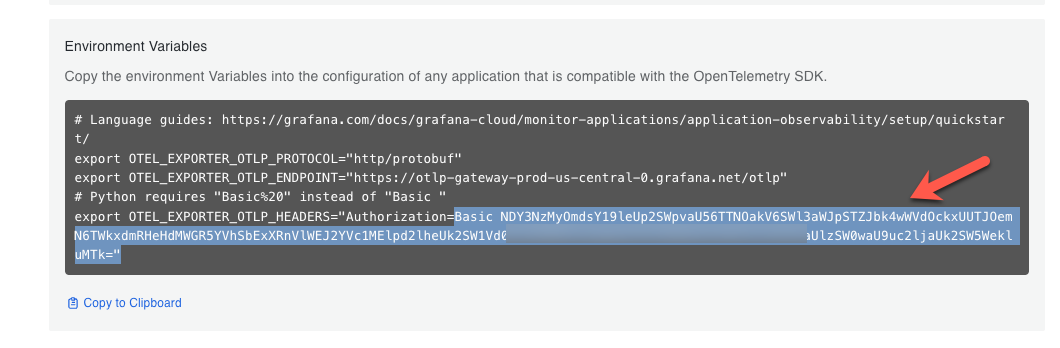
In the Environment Variables section, copy them down. What we’ll need in Anypoint Platform though is the value for the Authorization header. Keep this window open and move to the next section.
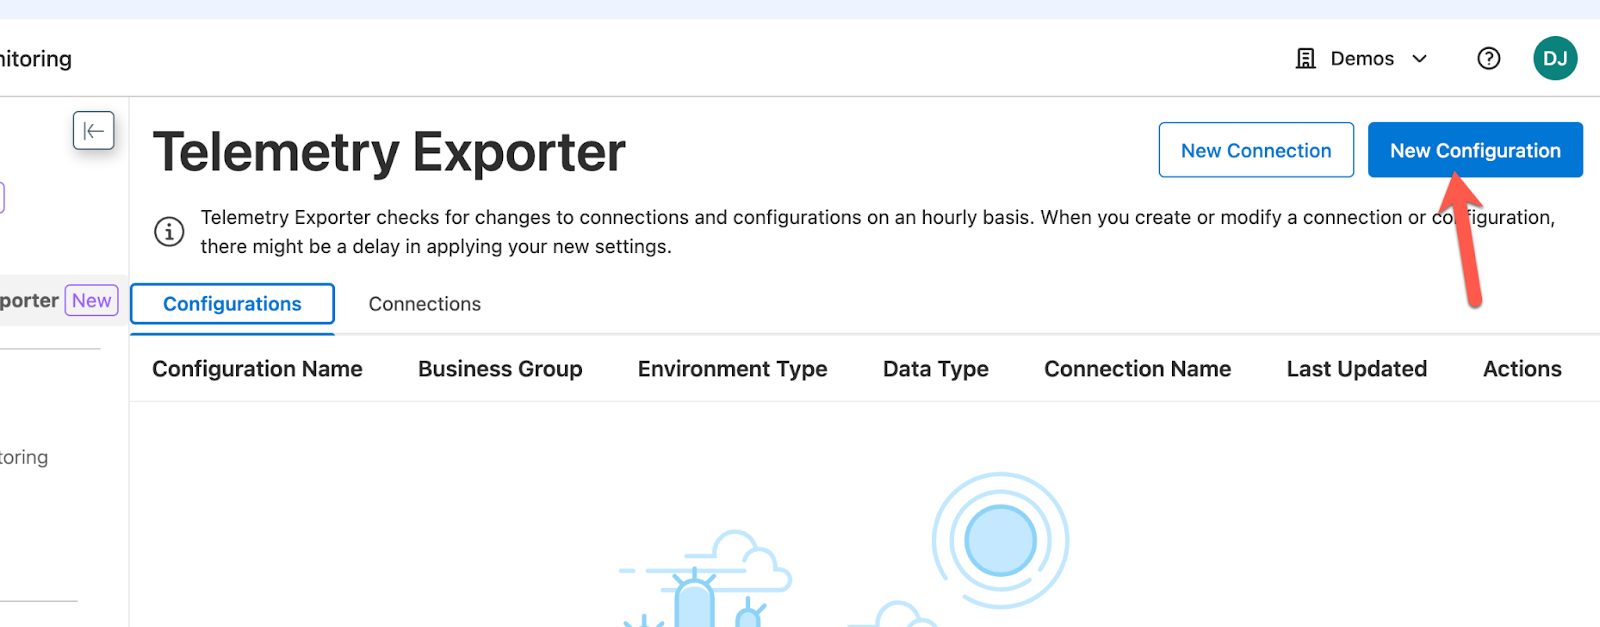
Telemetry Exporter – New Connection
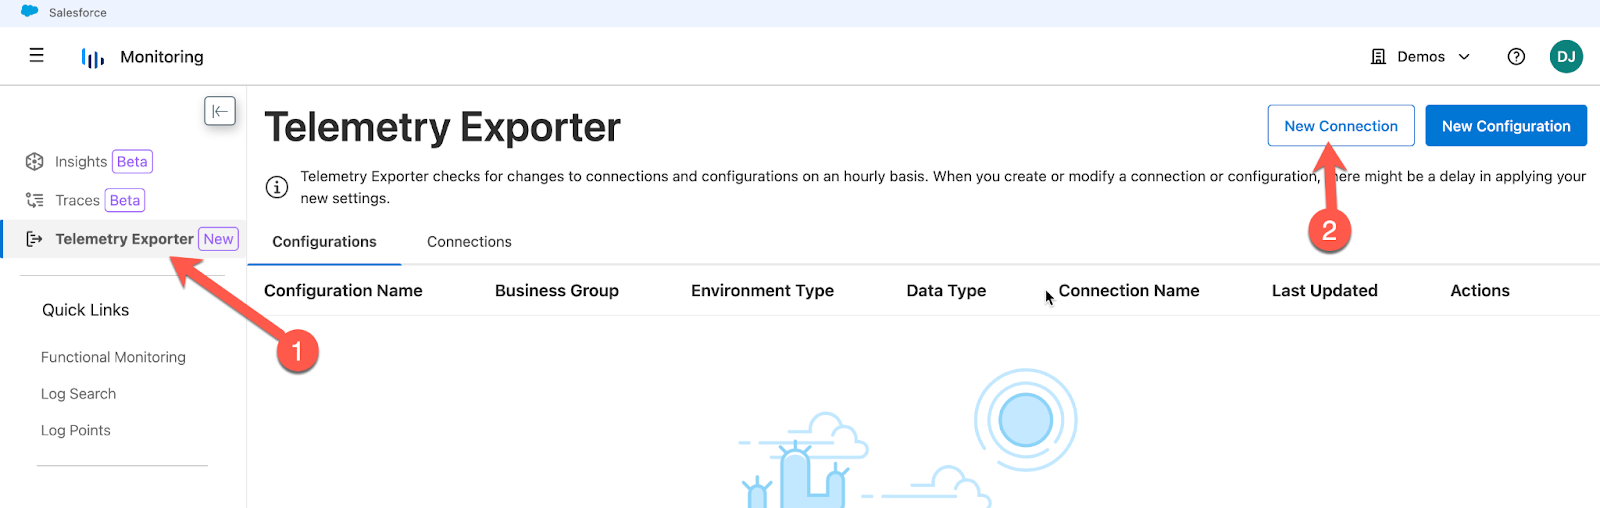
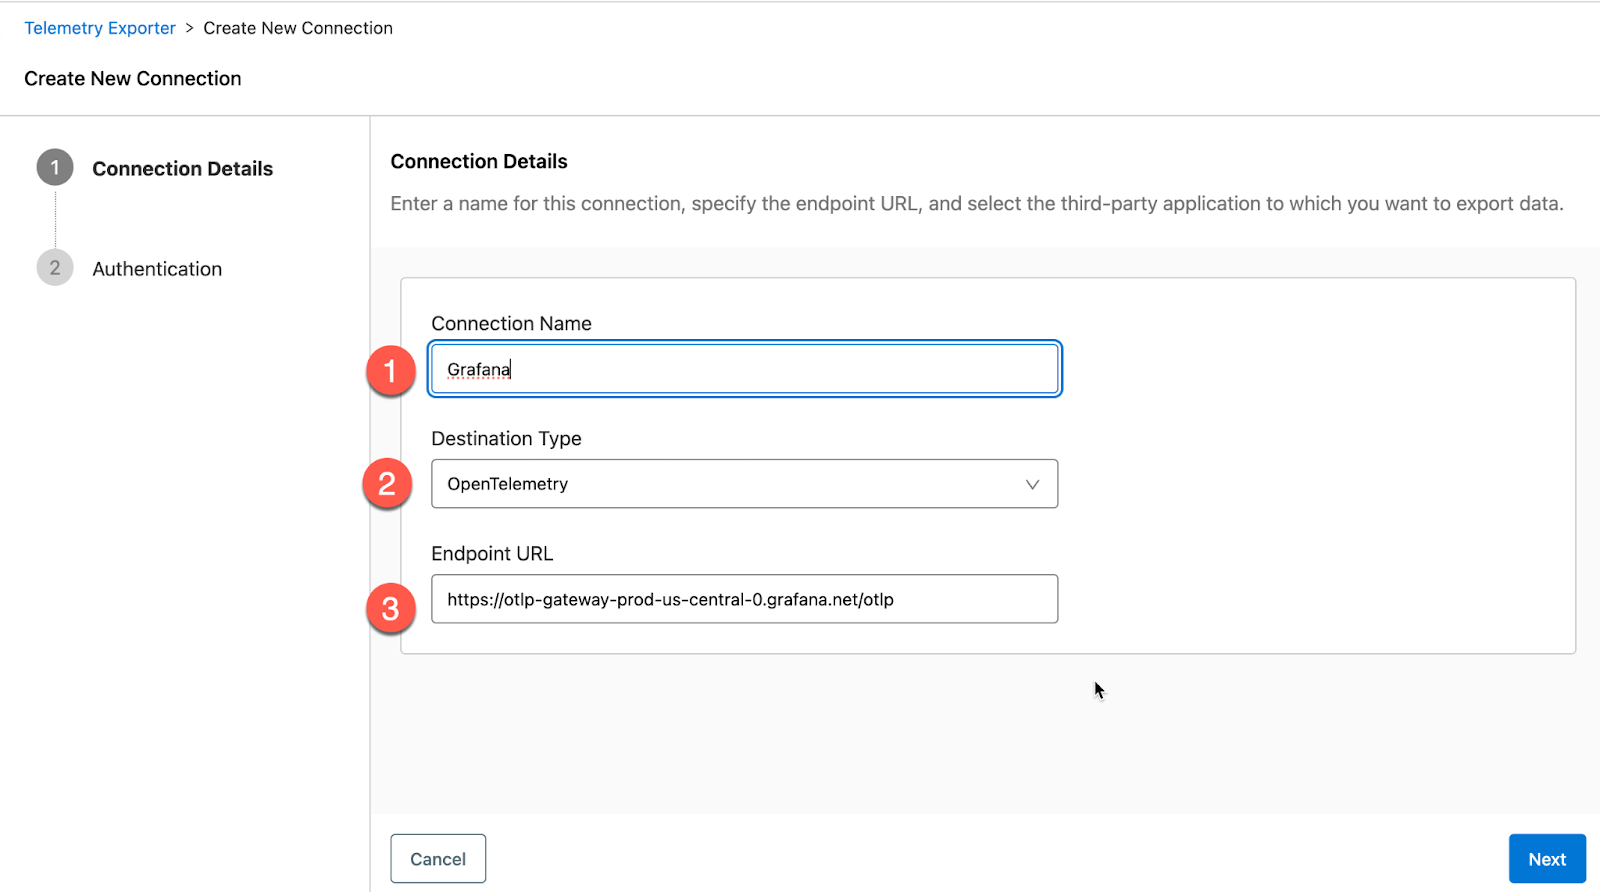
Switch back to Anypoint Platform and navigate to Monitoring. Click on Telemetry Exporter and then click on New Connection
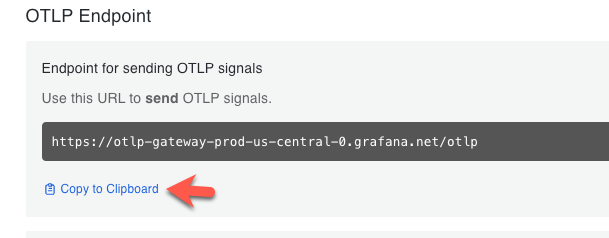
Switch back to Grafana and copy the OLTP Endpoint to your clipboard.
Jump back to Anypoint Monitoring and set the following fields.
- Connection Name – Grafana
- Destination Type – OpenTelemetry
- Endpoint URL – value you copied from Grafana (e.g. https://otlp-gateway-prod-us-central-0.grafana.net/otlp)
Click on Next.
Switch back to Grafana and copy the string in the Environment Variables section after the equals sign starting from “Basic”. Be sure to exclude the double quote symbol at the end.
Switching back to Anypoint Monitoring, in the Authentication window, fill in the following fields:
- Header Key – Authorization
- Header Value – Paste in the value that we just copied from Grafana
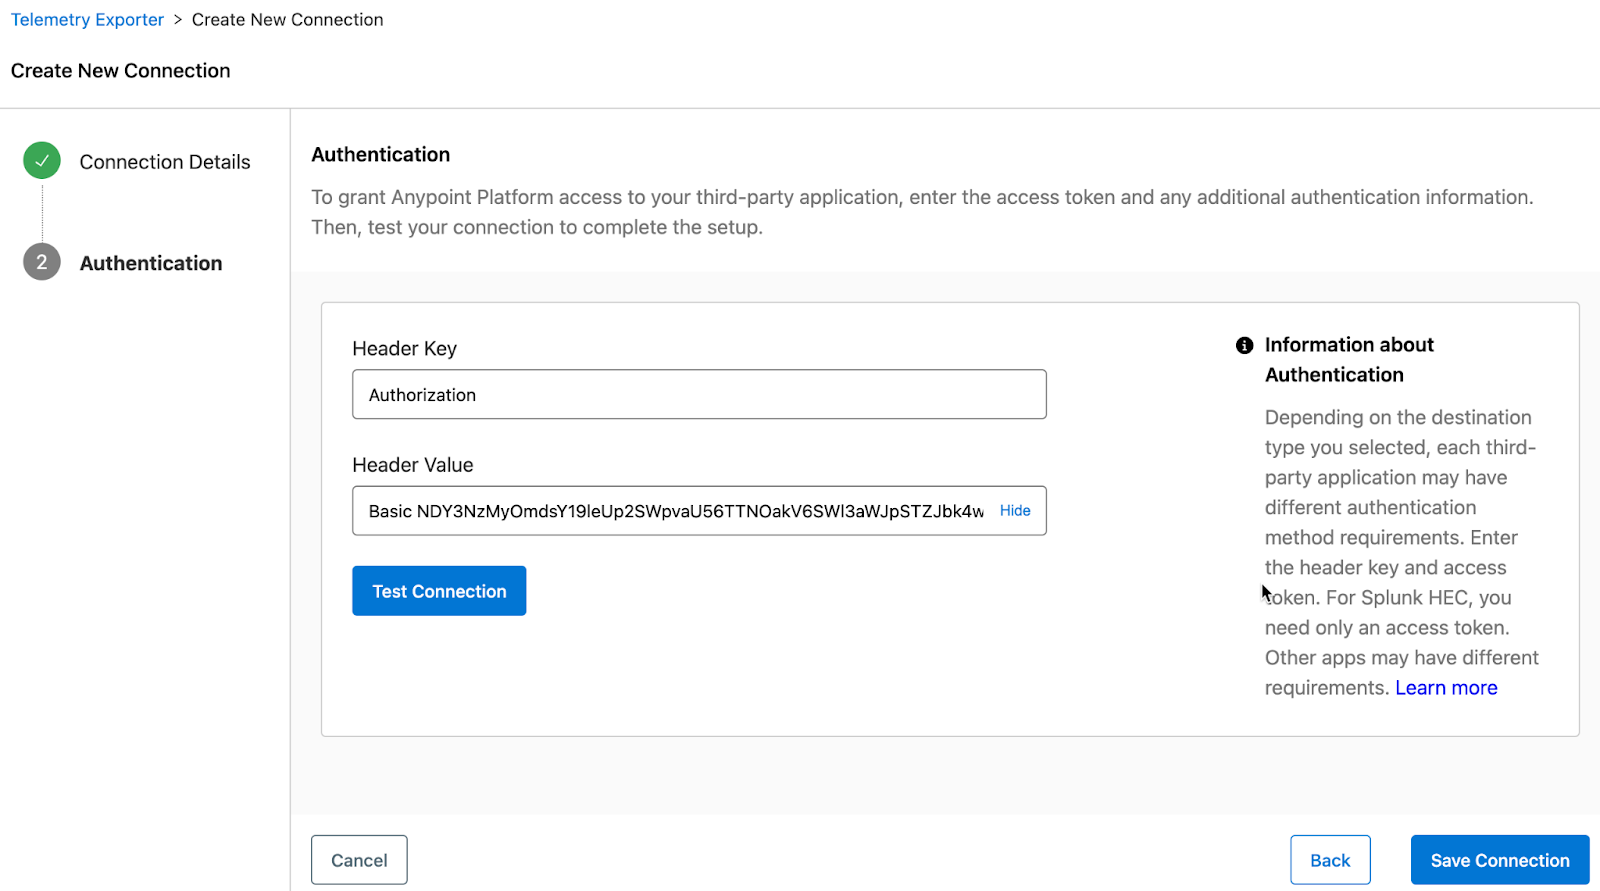
Click on Test Connection.
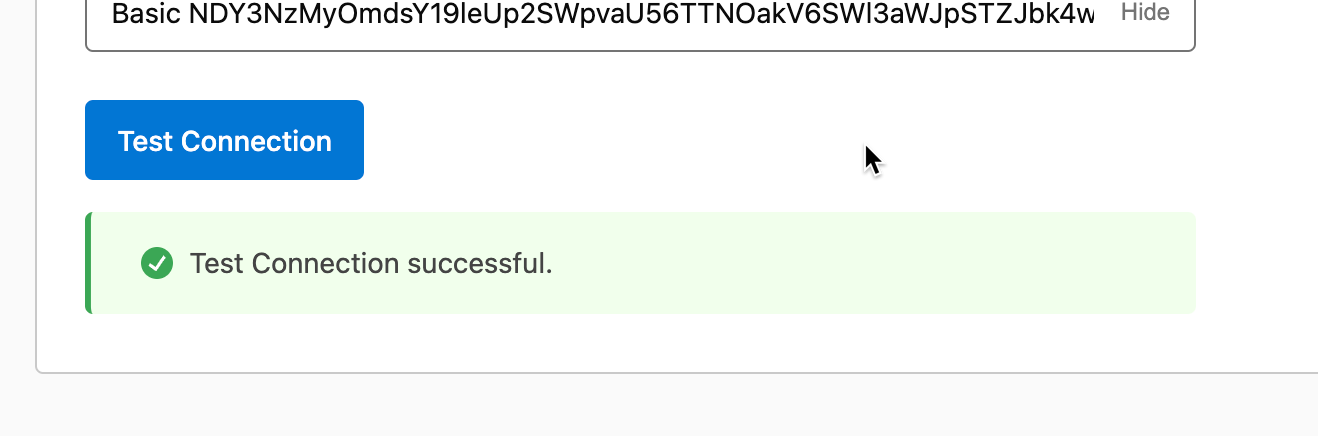
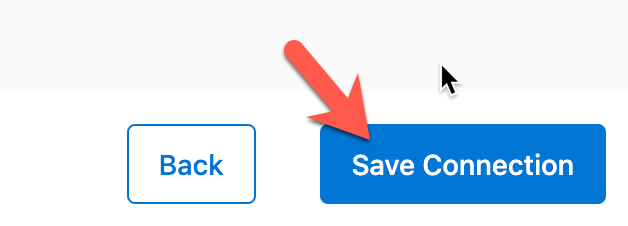
If you get a Test Connection successful. message, click on Save Connection
Telemetry Exporter – New Configuration – Traces
Now that we’ve configured a connection, let’s go and set up the configuration to send the traces. Click on New Configuration

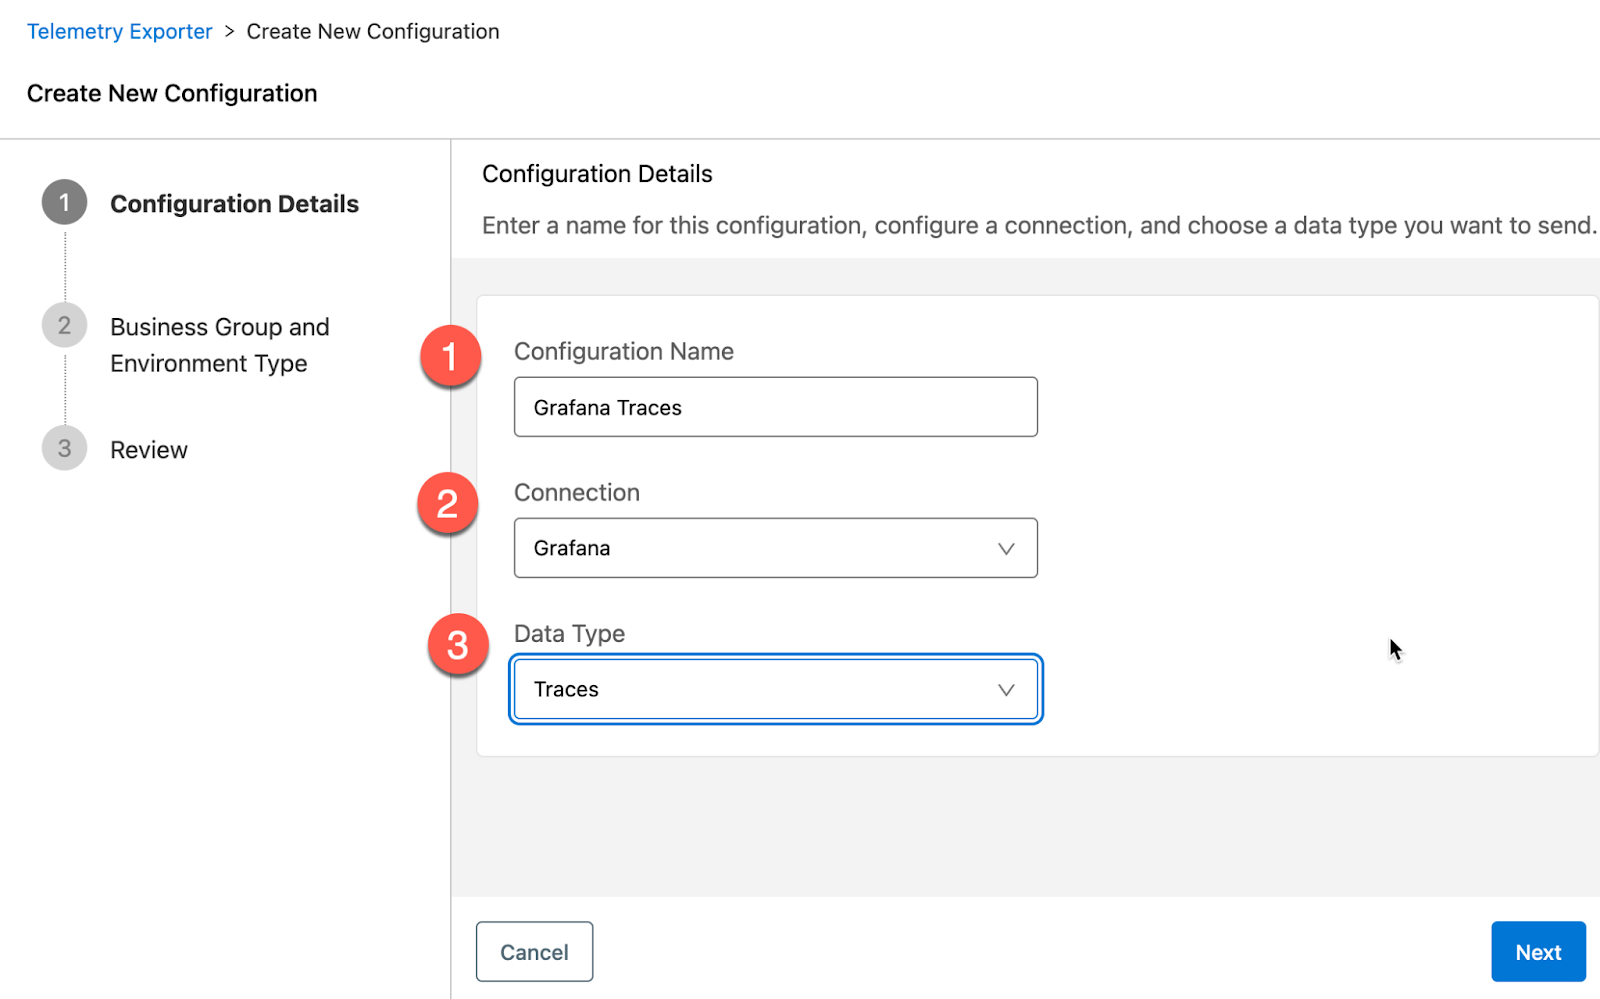
Jump back to Anypoint Monitoring and set the following fields.
- Configuration Name – Grafana Traces
- Connection – Select the connection name that we just configured e.g. Grafana
- Data Type – Traces
Click on Next.
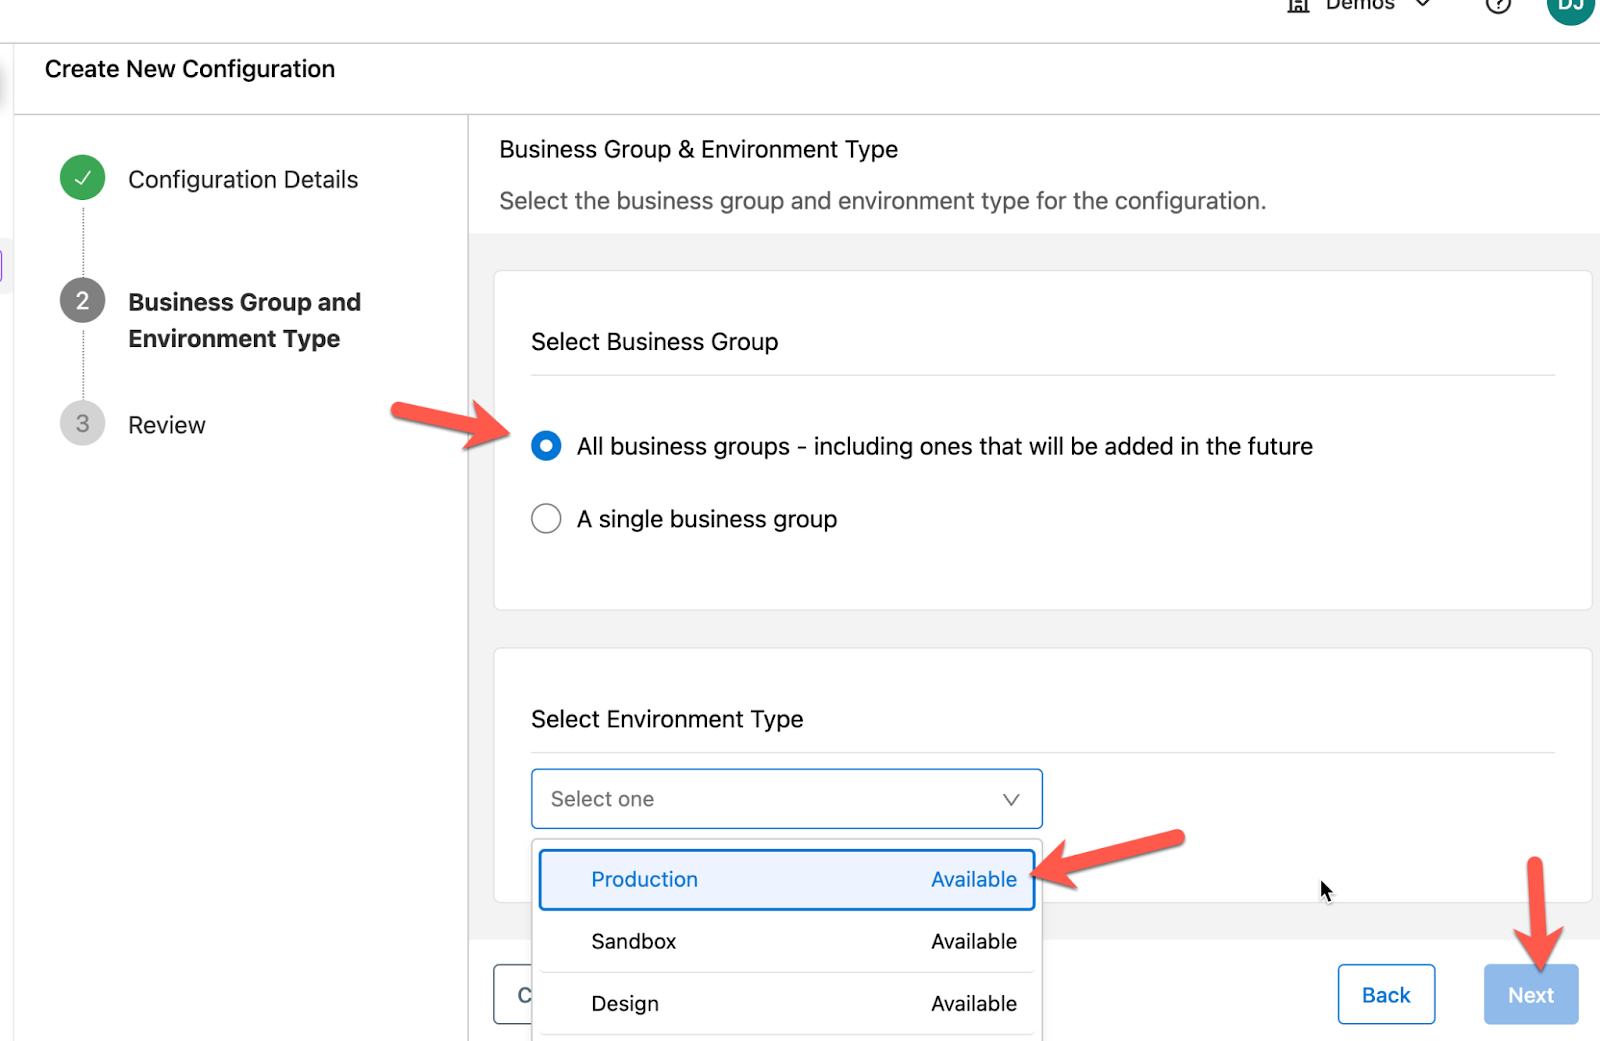
In the Business Group & Environment Type window, keep All business groups selected, and select the environment where your Mule application is deployed that is configured for distributed tracing.
Click on Next
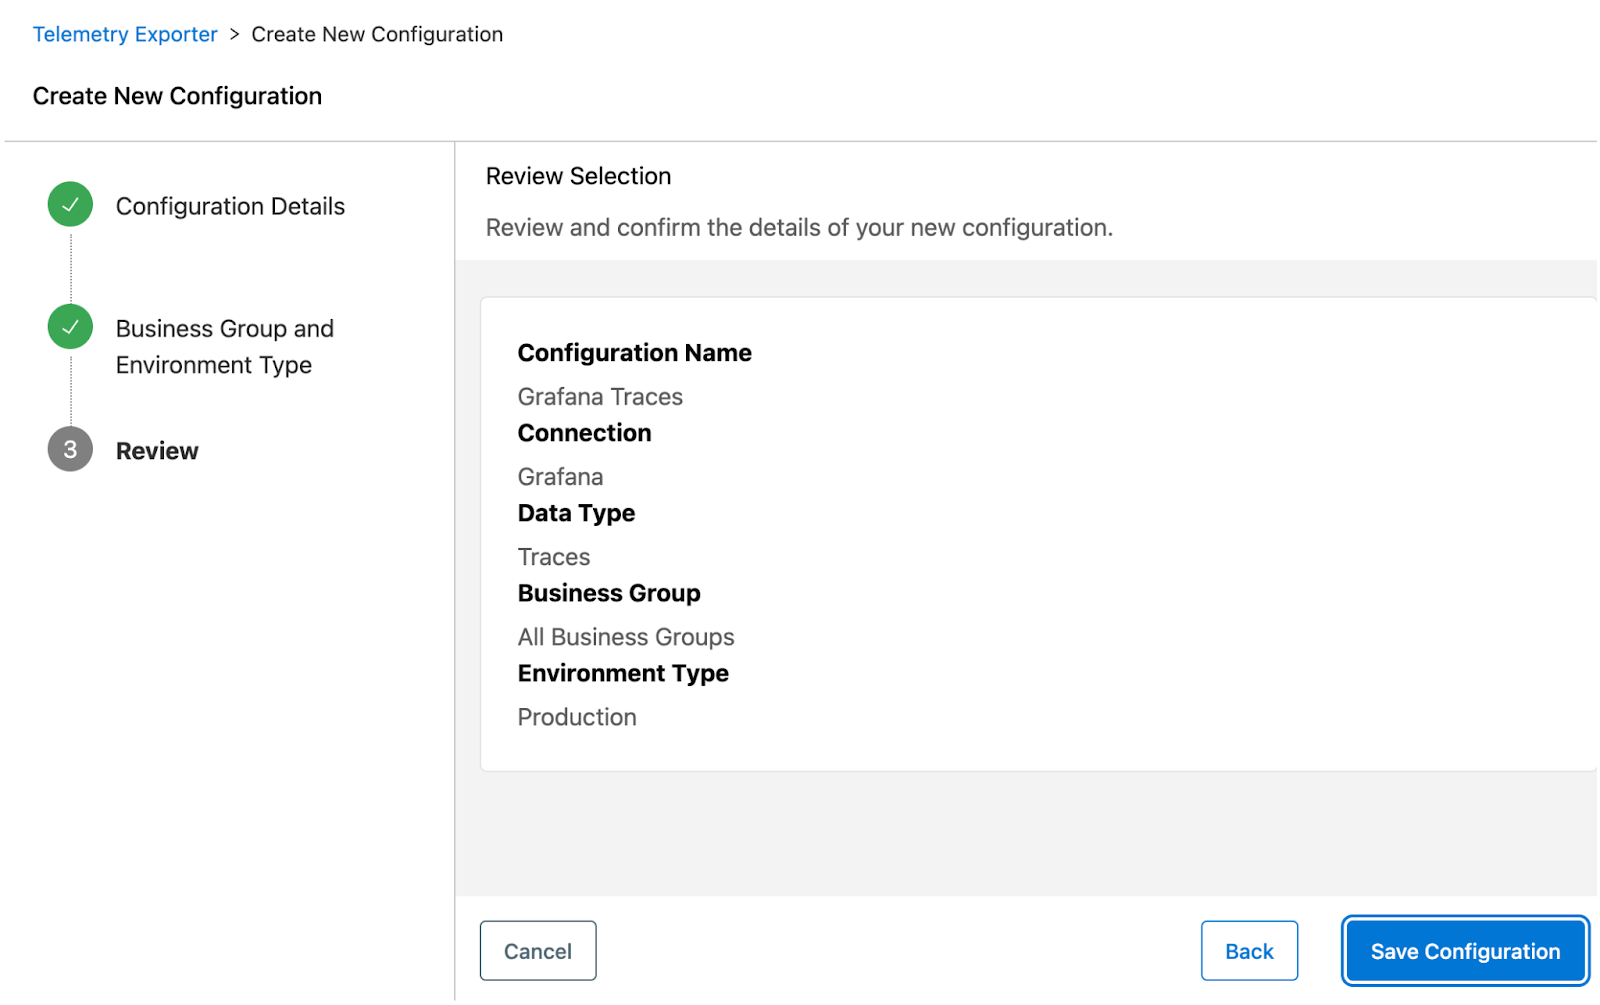
Review the settings and click on Save Configuration and move on to the next step.
Telemetry Exporter – New Configuration – Audit Logs
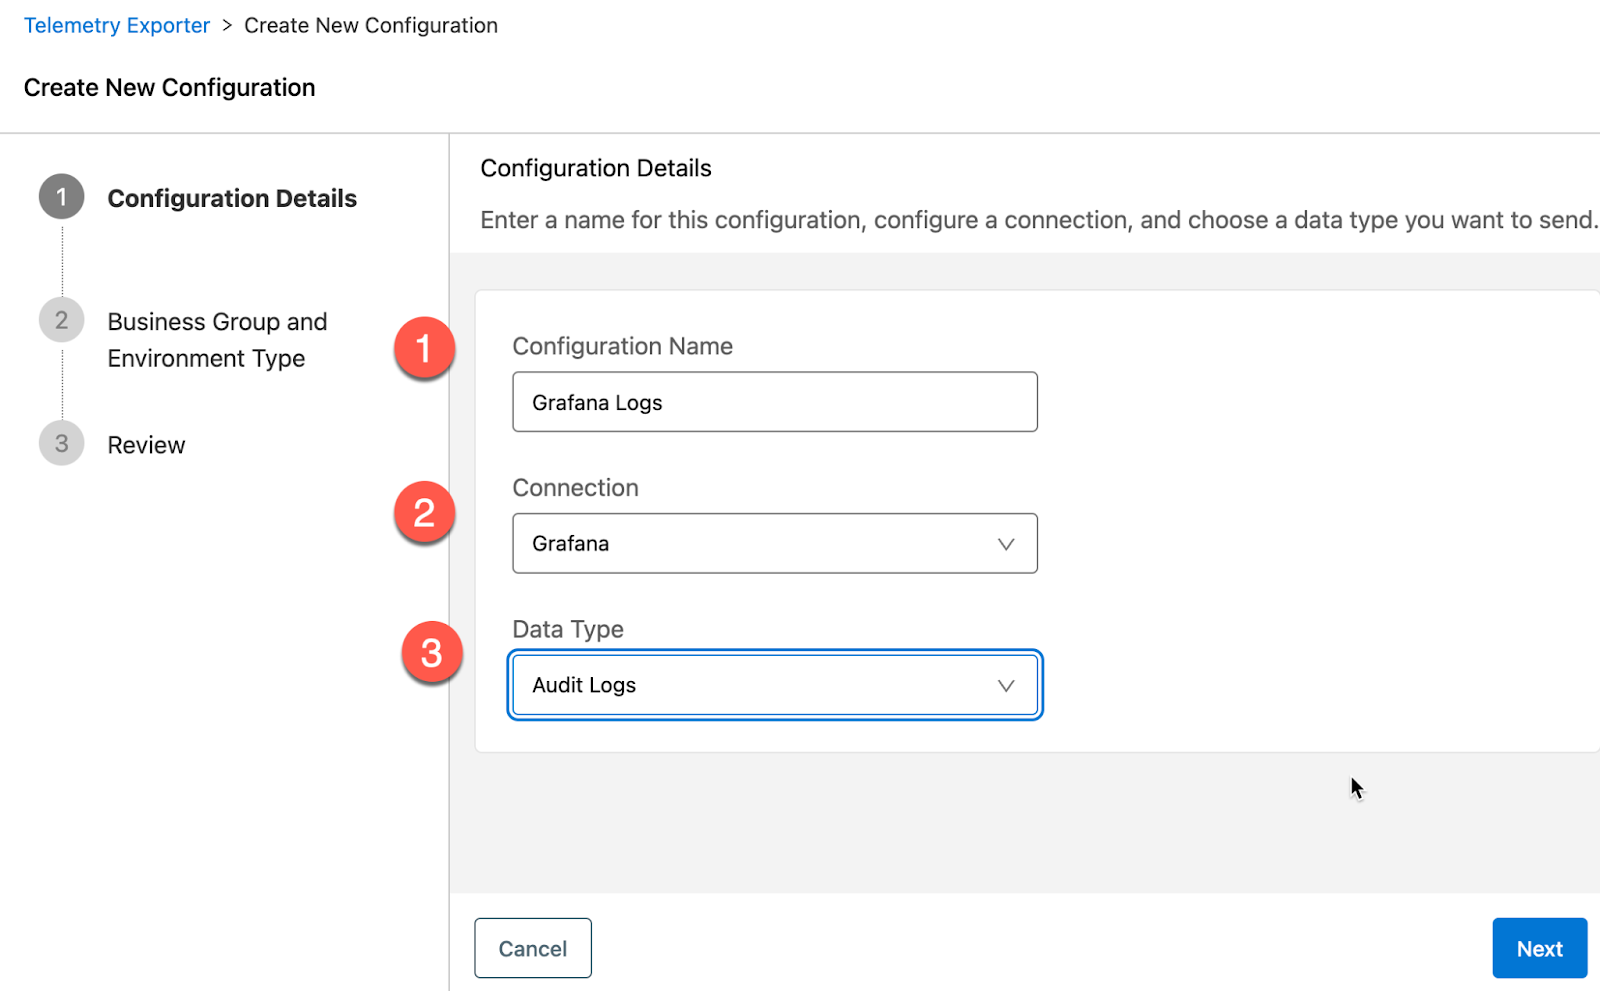
We can also send Audit Logs from Anypoint Platform to Grafana. Click on New Configuration
In the Configuration Details window, set the following fields.
- Configuration Name – Grafana Logs
- Connection – Select the connection name that we just configured e.g. Grafana
- Data Type – Audit Logs
Click on Next.
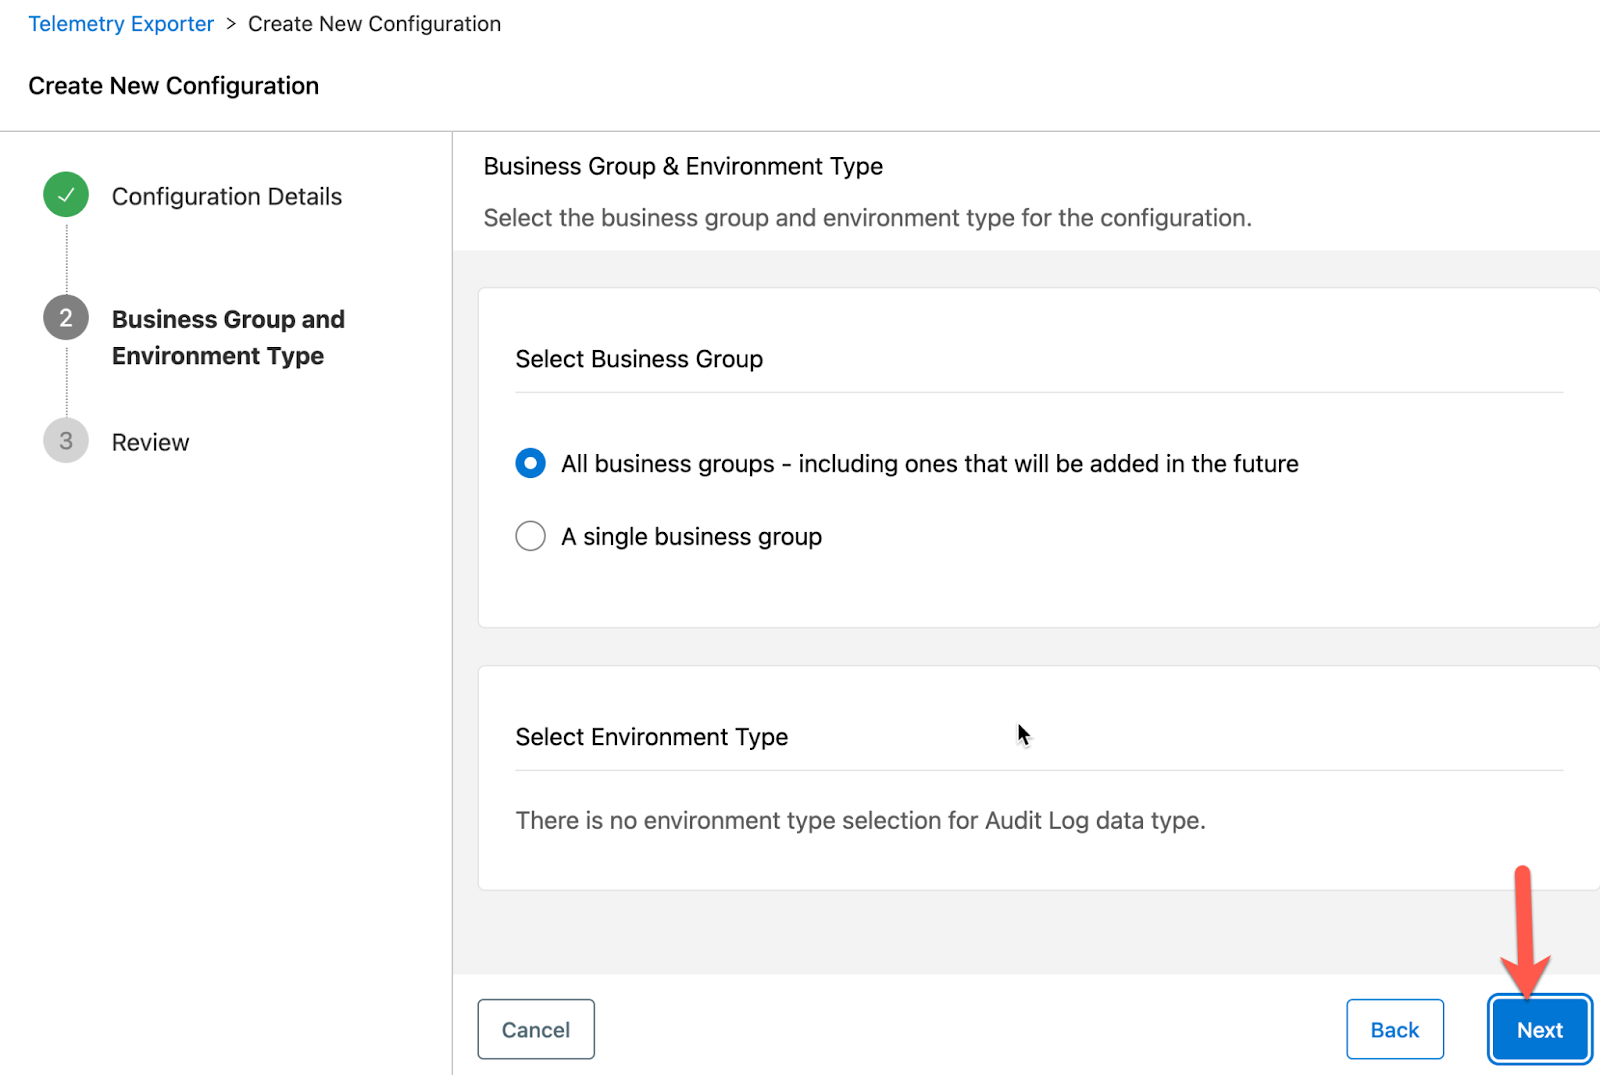
In the Business Group & Environment Type window, keep All business groups selected. Audit types are not tied to environments so go ahead and click on Next
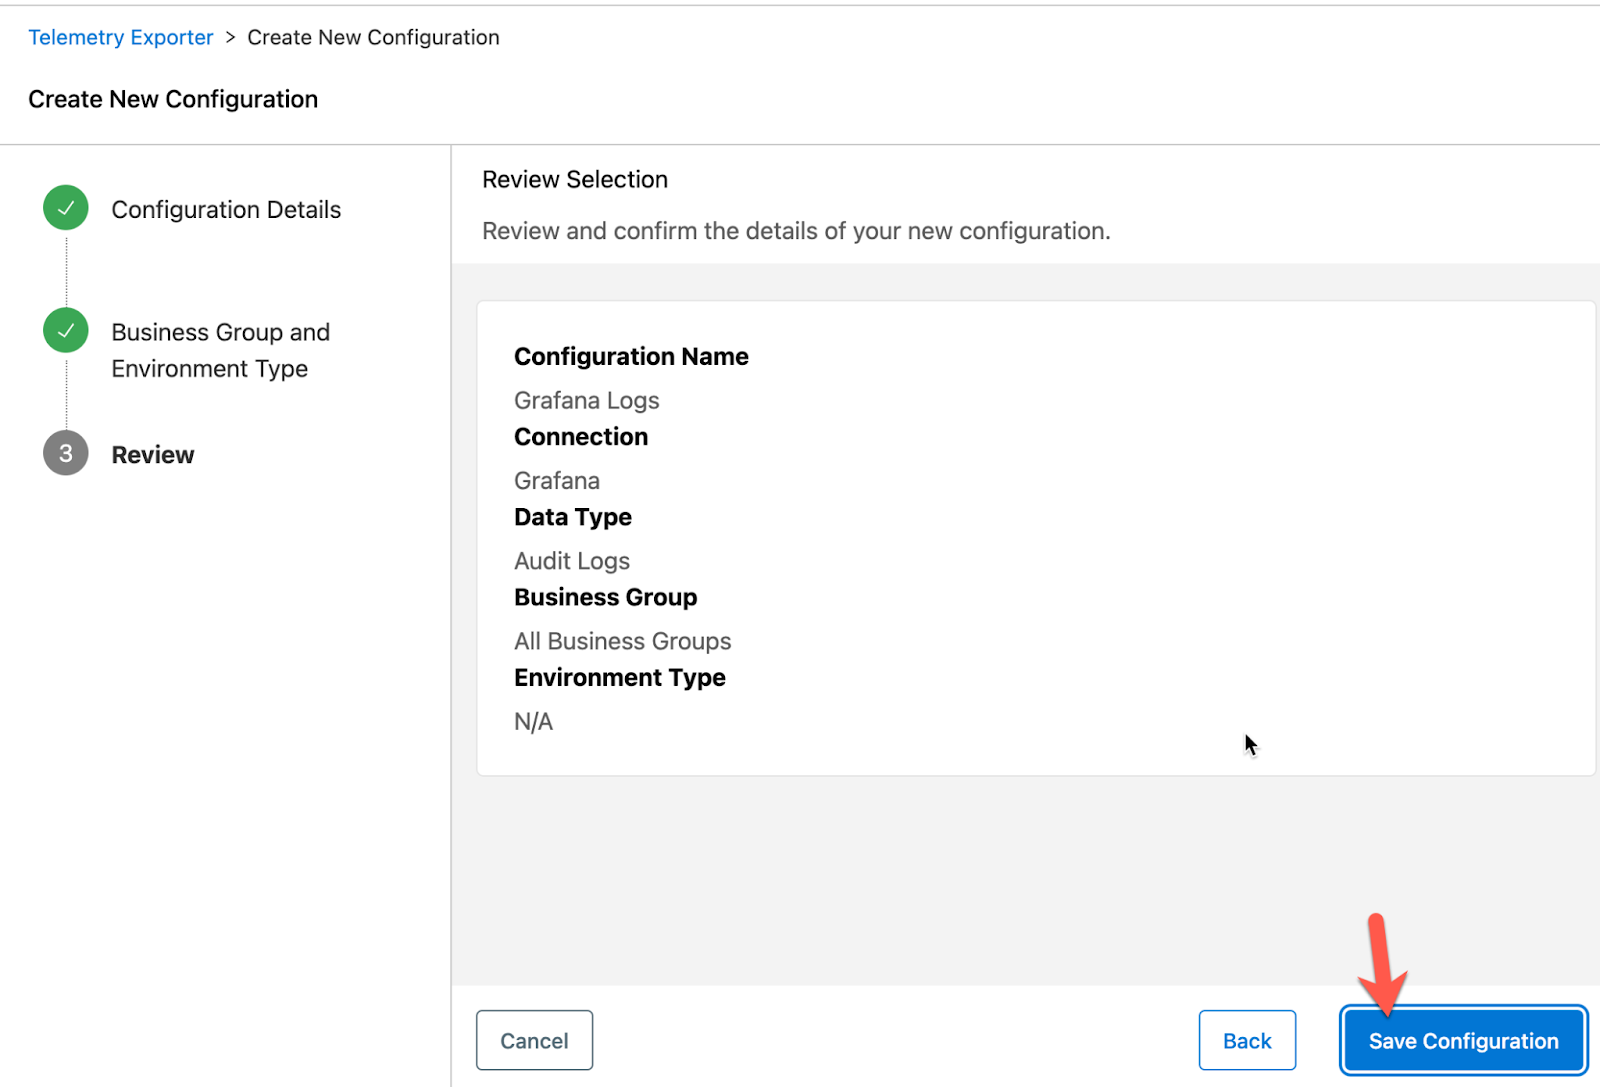
Review the settings and click on Save Configuration and move on to the next step.
Congrats, Telemetry Exporter is set up now and will start exporting telemetry data to Grafana. Be sure to run requests against your Mule applications to generate data that will be exported to Grafana before moving to the next step.
Grafana – View Traces and Logs
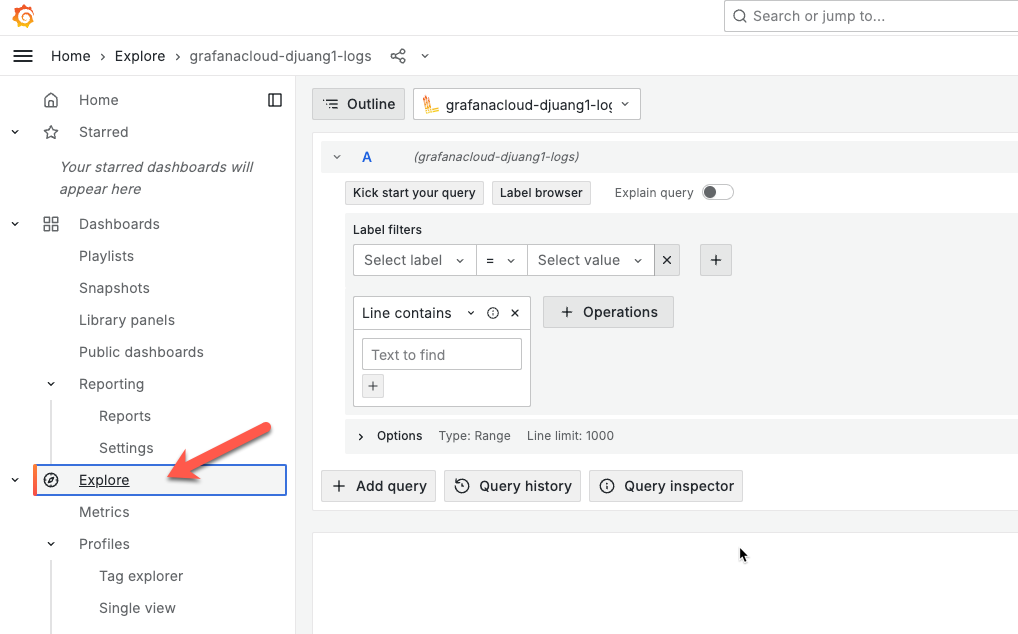
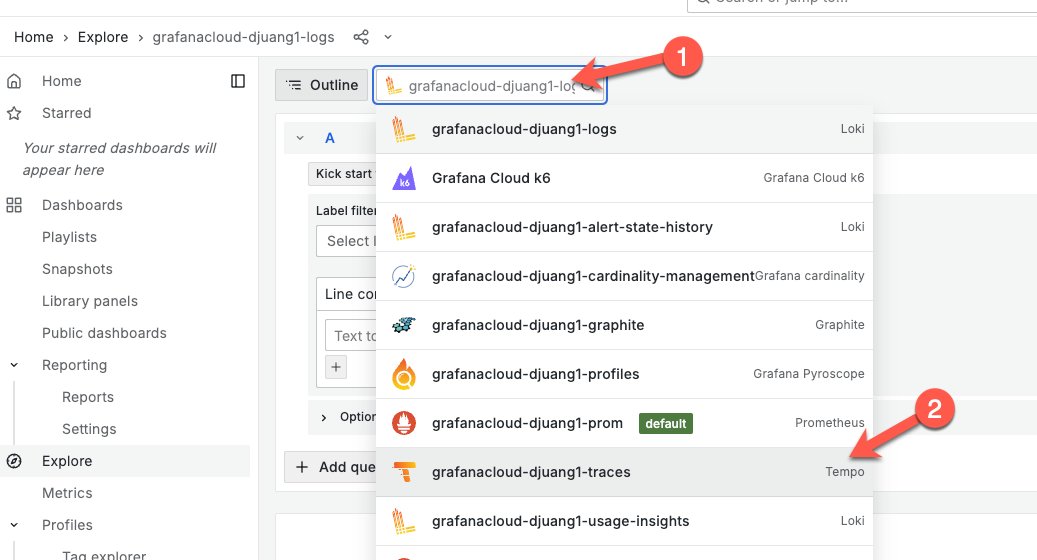
Assuming you’ve generated some telemetry data with your Mule applications, switch to Grafana and navigate to Explore
In the drop-down menu, select Tempo. Grafana Tempo lets you search for traces, generate metrics from spans, and link your tracing data with logs and metrics.
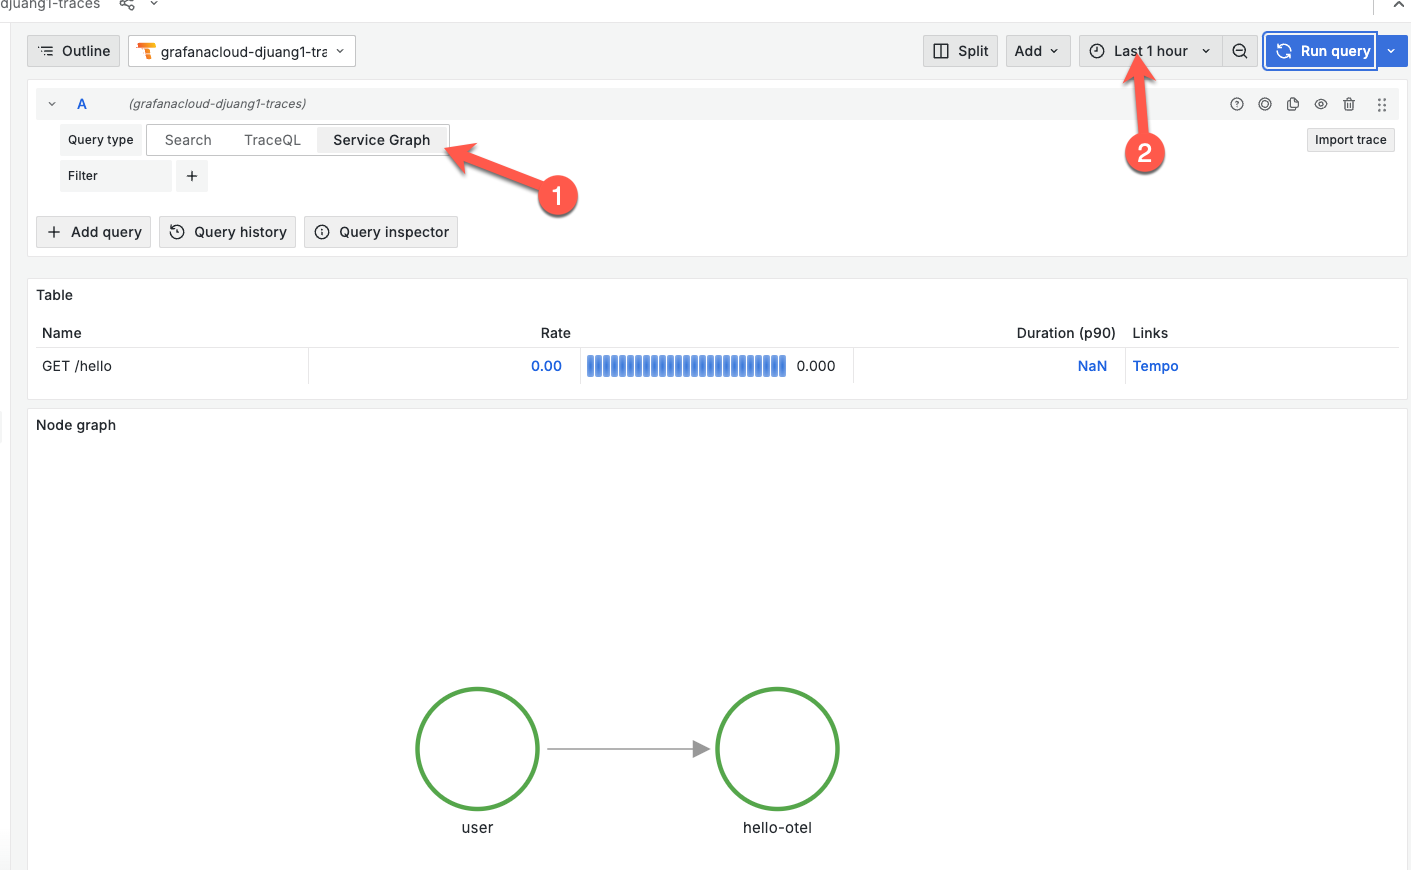
Click on Service Graph and change the time filter to Last 1 hour. Click on Run query if it doesn’t refresh the view. If configured correctly, you should see the name of your Mule application in the Node graph like the screenshot below. Feel free to click on the node and view the trace data.
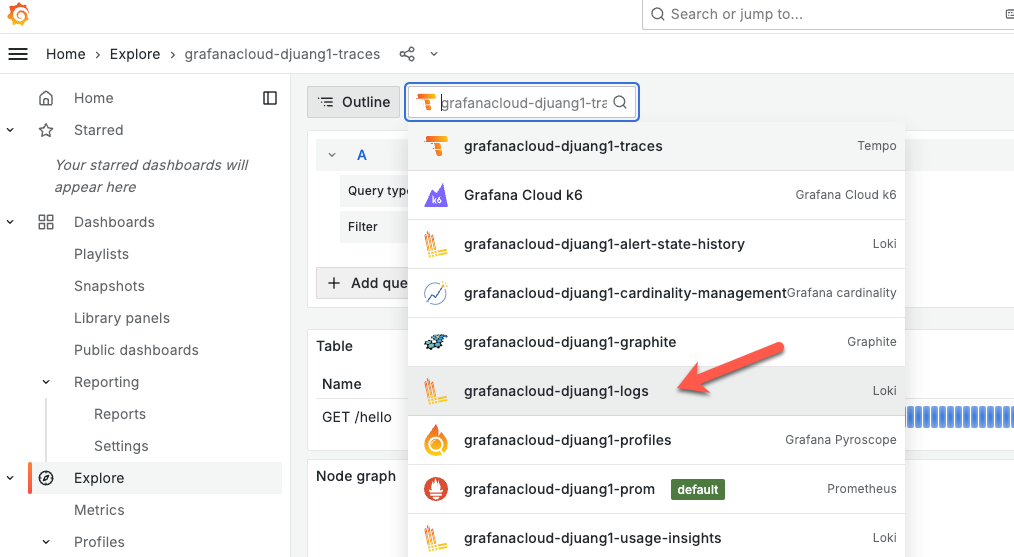
Next, let’s check out the audit log data. In the drop-down menu, select Loki. Grafana Loki is a log aggregation system designed to store and query logs from all your applications and infrastructure.
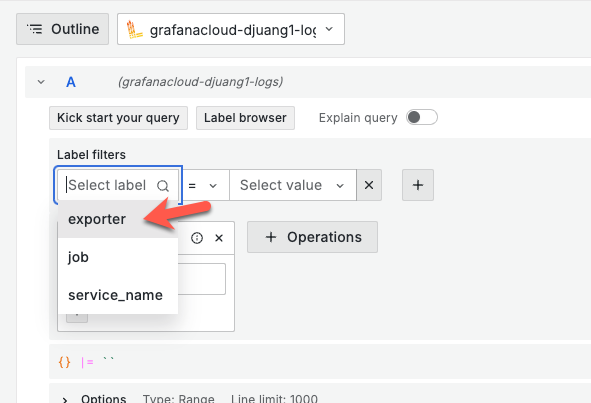
You’ll need to create a filter to see the data. Click on Select label and select exporter.
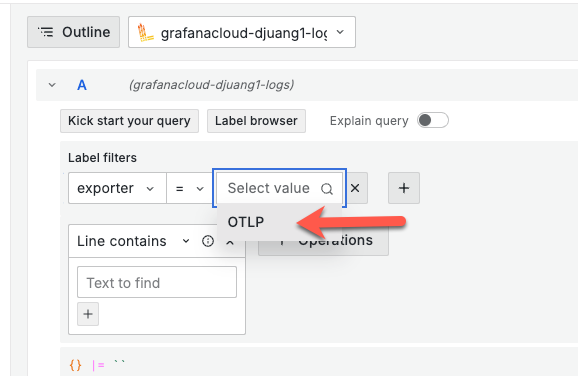
Click on Select value and click on OLTP
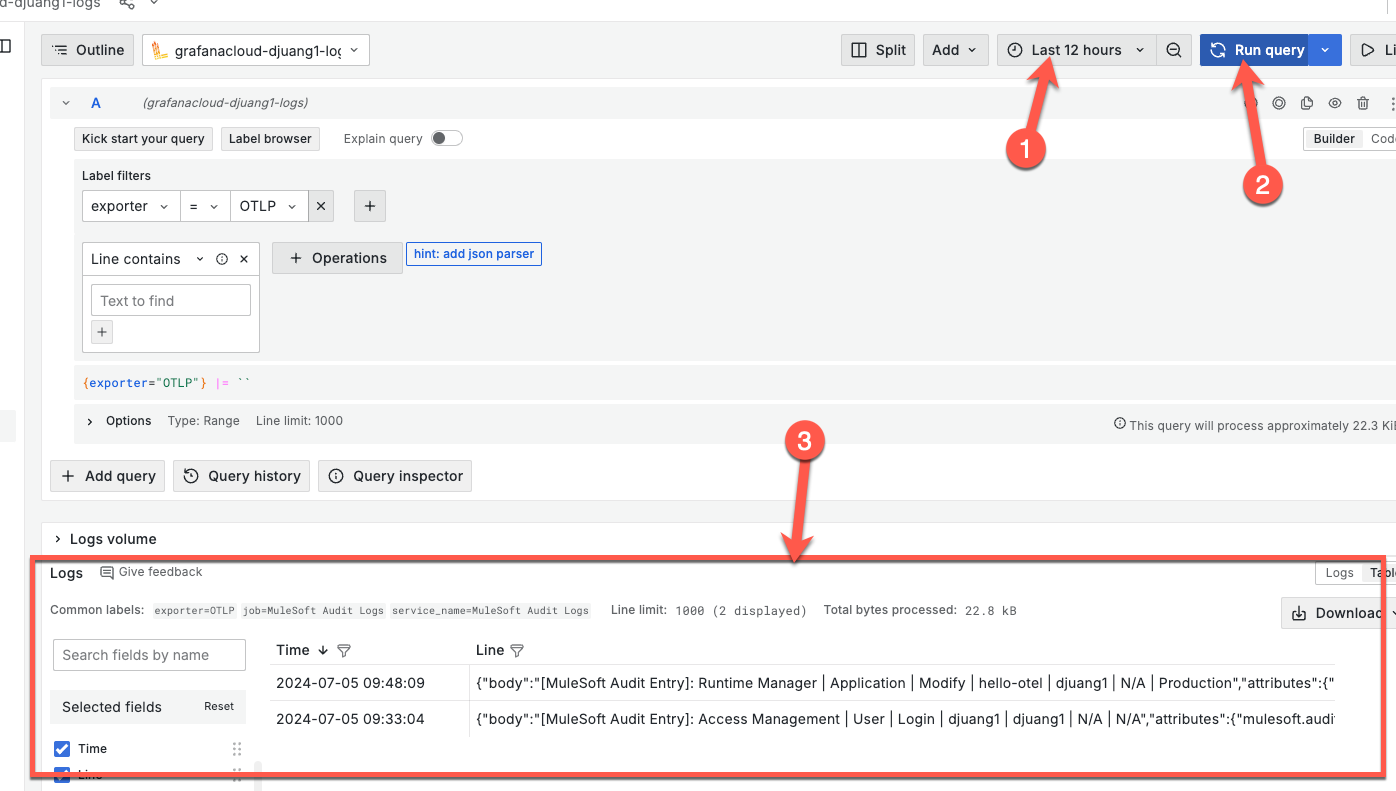
Change the time filter to Last 12 hours and click on Run query. You should see log data from your Anypoint Platform. If you don’t see any data, go back to the Runtime Manager and stop and start one of your applications. Give the exporter some time to send data over before click on Run query again.
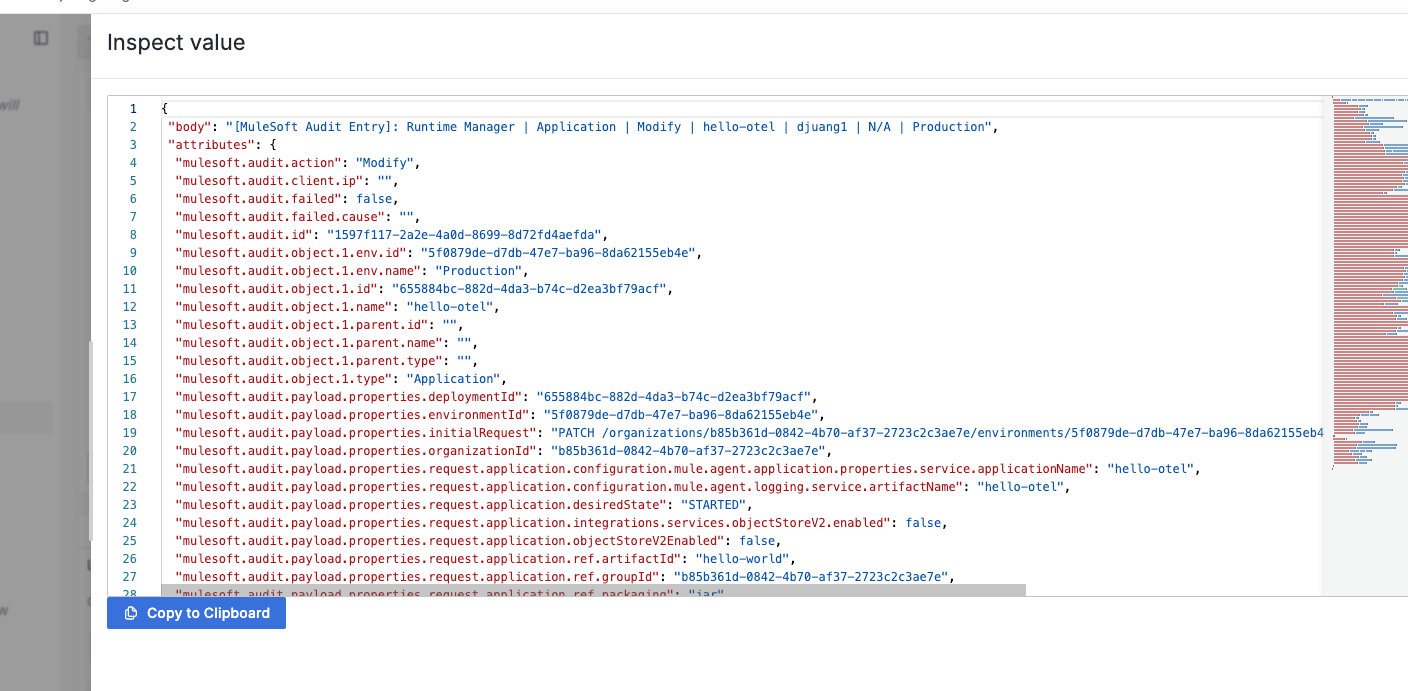
In one of the lines, click on Inspect value on the far right.
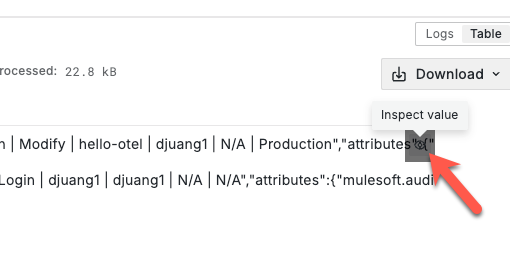
You’ll see all the data that Telemetry Exporter sends over for each event.
Congratulations
Congratulations, you’ve successfully configured MuleSoft Telemetry Exporter to send data over to Grafana.
Leave a Reply